Analysis/Output Tab
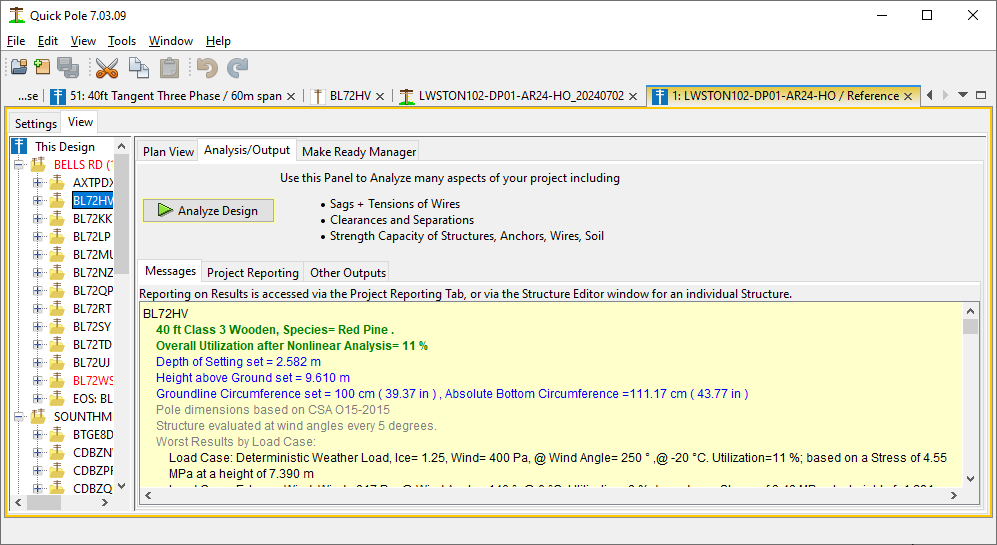
This window tab is dedicated to providing all of the analysis results for this Design.
In most cases there will be some red text in this tab indicating that the Design is in need of analysis and that if anything appears available below, it is out of date.
There are four main aspects to this window:
- "Analyze Design" button - Just like the name suggests, pressing this button will bring everything up to date. The Explorer View will be updated with the result of the analysis through color coding. The Messages area will populate with status-based messages and the Work Plan Area will highlight structures and spans with any issues.
- Messages - Provides a sorted list of results by Street, then by Structure or Survey Name for everything in the project (immediately after analysis). You can select any item in the Explorer View and get focused messages on just the selected item, at any level. Generally if an item is red in the Explorer View, you can keep expanding the nodes in that view into sub-items until you discover the cause of the red indicator that bubbled up to higher levels. These messages can be copied and pasted to other applications if click the mouse in the message area, press CTRL-A to select all and then CTRL-C to copy.
- Project Reporting - this enables project level reports to be generated, plus any number of structure level reports for each structure in the Design that is not marked "End of Study".
- Other Outputs - this contains options for exporting results in various CSV formats.
To understand these results better, please visit "Understanding Load Case Analysis"
Explorer View after analysis
The Explorer View shows a listing of all Structures in the Design, grouping all structures located on a street on the same branch of the tree and then sorted by Structure Number. If your project is large, it is highly suggested that you set the Street or Lead name for every Structure so that this Analysis Tree can take advantage of that.
The Explorer View uses a “Bubble Up” feature where all issues below a tree node (color) are raised to the higher visible nodes. The color scheme is:
• Black – everything OK
• Orange – Warnings
• Red – Errors
By clicking your mouse on any “+” sign of any node, you will be expanding that node to see what other nodes are beneath. Each Structure Location Node will have one node for the structure itself and possibly others for an Attachment Group Node and an Anchor group Node. Each group node can also be expanded to show the actual attachments or anchors individually. This way you can drill down to the underlying issue. Please go to the Explorer View section for more information.
Messages Area after Analysis
You may have noticed by now that the Message Area follows whatever node is selected in the Explorer View. By default, whenever a Design is analyzed, the Message Area will contain all messages from all nodes in the Explorer View.

How to Interpret the Analysis Messages
Quick Pole performs many tests and validations as it reviews each project. During this review it generates summary result messages, warning and error messages. These are all associated with a particular node in the Explorer View. Even if everything checks out OK, a minimum of one summary message will be generated to tell you this. If warning or error conditions are detected, the node will contain even more messages to alert you to this fact. The messages are color coded similar to the nodes:
• Black – Basic information or facts
• Orange – Warning message
• Red – Error message
• Green – OK message
• Gray – Informational message. Usually in association with another message to provide information that may be useful.
• Blue – Informational message that you should definitely read.
Work Plan Area after analysis
The Work Plan Area will highlight all structures and spans with underlying issues.