Structure Reporting
While the Analysis Messages are intended to be helpful, there is a limit to how much information can be provided in summary form in that format. There are many situations where you will need more detailed information to assess a situation, or for basic reporting needs. This is where the detailed reports meet this need.
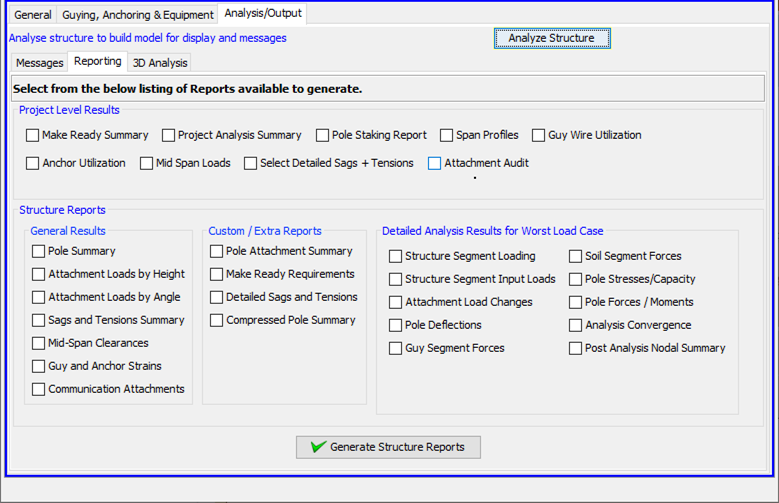
Structure Reports are available in the Structure Window and through Project Level Reporting.
The reports are broken down into categories to help you find the one you need.
For most common needs, the reports under the General category are expected to be used. The reports under the Detailed category are there to enable a super deep detailed analysis of what is happening to the pole. User reports are provided to meet the need of specific user groups and will change in nature and quantity over time. Expert Reports provide very detailed results of some of the internal workings of Quick Pole and are normally not displayed as an option. You can see these reports by setting the "Expert" option on in User Preferences.
Report categories available are:
General Reports
The General Reports Menu consists of the following reports:
1. Pole Summary
This report captures all the basic information about the pole, the settings that were applied to it, more detail on the fibre stress utilization, plus all the informative messages that were previously generated for this pole.
This three page report captures the:
- specific details about this pole,
- the storm loading, Line Grade and overload factors used in the analysis,
- the directions and length to adjoining pole spans and local anchors,
- summary results from the load analysis and all related messages
- Make Ready and Design Notes, if set.
The Fibre Stress summary results show the worst fibre stress location on the pole, under the maximum load condition, after a full Nonlinear Analysis has been performed. All overload and safety factors have been incorporated so that less than 100% Utilization of the pole is the desired objective. If the result is over 100%, the pole cannot safely handle the loads and may already be in an unstable (bucking) condition.
It is possible to have an overloaded pole that is stable as the Nonlinear Analysis does not stop at 100% utilization. It does this to produce results showing the area of the pole needing the most help; while also highlighting that the pole is unsafe. You can re-work the design of this pole and re-run the analysis based on this knowledge.
2. Attachment Loads (by Angle)
This is a report of the attachments to this pole, sorted by their attachment angle. All loads are “unfactored”, meaning that over-load safety factors are not applied. The exception is guy loads which can only be calculated after the analysis.
Some attachments are held away from the pole on a bracket or other hardware, while others are large and have their center of gravity offset from the pole. For both these purposes, the Eccentric Distance is provided which shows how far the attachment (or its center of gravity) is from the side of the pole. This distance multiplied by the maximum vertical load will create a Bending Moment; which Quick Pole also considers. This report identifies specifically the "Input Loads" that Quick Pole needs to consider when analyzing the pole. During the Analysis stage, Quick Pole will also consider the additional Bending Moments created from the applied Vertical Load not being applied directly to the absolute center of the pole, but at the pole's face. Even when the attachment is attached directly to the face of the pole, some bending moment is possible since it is still offset in reality from the absolute center of the pole. This report will not show that aspect, just the loads as they are applied to the face of the pole. The Eccentric Angle identifies the angle of the location on the pole where the attachment is attached, as measured from the absolute center of the pole. It will impact the Z and X direction Bending Moments in magnitude and sign. If there is no Eccentric Distance, both the Eccentric Distance and the angle are normally blank.
The Vertical Loads are separated into four components so that you may be able to validate each one individually. Negative Vertical Loads are downwards and positive ones are upward. The Attachment component is the weight of the attachment that this pole needs to support. For hardware and similar items on the pole, this would be its entire weight. For span to span attachments, this pole would be expected to support half of the weight; assuming level ground and the same attachment height on this and the adjoining pole. The value shown is for informational purposes and will always be half of any span-span weight. The same can be said for the Attachment Ice, which is the ice assumed to accumulate on the attachment.
The Net Max and Net Min Vertical Loads are calculated from:
- Sag and Tension results, in the case of Span - Span attachments
- From the item itself, in the case of hardware
- From Pole Analysis Results in the case of Guying and Bracing.
For each attachment, both the condition and results for both the minimum and maximum vertical loads is determined and presented in this report. For Span-Span attachments, the minimum vertical load could have an impact on the type of hardware used to attach to the pole. Some hardware types cannot safely support positive vertical loads (uplift).
The Guyable Loads normally come from the Sag & Tension calculations of Span-Span attachments. For those this is calculated from the Horizontal Tension value under the Maximum Tension condition; divided into its Z and X direction components based on the angle of the attachment. For guying and bracing attachments these values will come from the Pole Loading Analysis. For Hardware and similar items there can be a small guyable force component created from any bending moments the item is creating. The value is calculated from the resultant Bending Moment divided by the attachment height and divided into Z and X direction components of force based on the angle of the attachment.
The Wind Load values are calculated as:
- The maximum surface area exposed to wind, in the case of hardware attachments
- One-half of the wind load (attachment plus ice), in the case of Span-Span attachments, as each pole in a pole line should share wind load equally.
- One-half of the wind load (attachment plus ice), in the case of guying and bracing attachments. The earth is expected to support the other half.
At the top of the report you will find the maximum wind pressure used to create the Wind Load values. This will be the maximum of the defined storm loading and the Extreme Wind condition, if defined. Similarly, the maximum ice thickness is the maximum ice thickness from the defined storm loading and the Extreme Ice condition, if defined.
3. Attachment Loads (by Height).
This is a report of the attachments to this pole, sorted by their attachment height. All loads are “unfactored”, meaning that over-load safety factors are not applied. The exception is guy loads which can only be calculated after the analysis.

For a description of the values displayed on this report, see "Attachment Loads (by angle)".
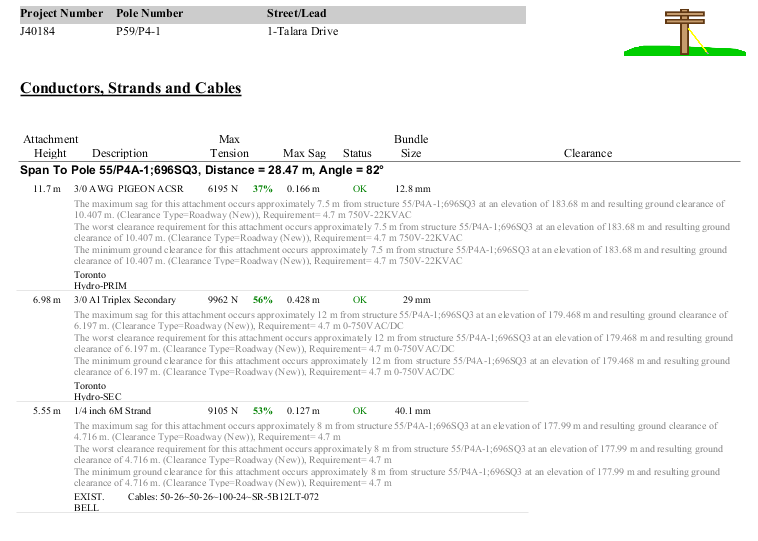
4. Sags and Tensions Summary
This report summarizes the results of the Sags & tensions calculations by highlighting the most significant values to a Pole Loading Analysis.
The report identifies, for each span to span attachment the:
- Span length
- Elevation difference in absolute terms considering attachment heights and groundline elevations of the two poles supporting the attachment.
- The Horizontal Tension of the attachment. This is the amount of tension present at the lowest sag point mid-span, which is the tension that the pole structures need to support for any pole line angle changes.
- The "From" and "To" tensions represent the tensions at the attachment points of the pole. It will include the effects of the attachment weight from the sag point to the point of attachment.
- The Maximum and Minimum Vertical Loads at the "To" and "From" span ends of the attachment.
- The total Wind Load of the attachment, end to end. One half of this value would be applied to each supporting pole.
- The point of Maximum Vertical Sag and the point where this occurs. The distance is always from the lowest attachment point. If this value is less than zero, it means there is too much elevation difference between the "To" and "From" ends to create an actual sag point. The difference is so great that the sag point is "theoretically" at a point before the previous pole.
5. Mid Span Clearances
This report shows the sag and ground clearance, plus any mid-span or on-pole separation issues, for every wire attachment on the pole. This report is sorted by attachment angle.
For each direction of attachments from the pole, the at-pole separations and mid-span sags are compared and listed, sorted by their mid-span sag value. The condition of maximum sag can be due to thermal conditions or loadings. The detailed Sag and Tensions Results Report will identify the maximum sag condition for each attachment and the groundline clearance at the point of maximum sag. For long span lengths, Thermal Sag may be used in some of the mid-span separation tests, according to National Codes.
Quick Pole takes into account the heights of attachment on both poles supporting the span and their groundline elevation. Using this information it calculates the effective elevation difference from the attachment's perspective, the "Maximum Mid-Span Sag" for each attachment and how far out from the pole with the lowest attachment this maximum sag point exists. It then calculates the closest point where a projected line of sight would come closest to this maximum sag point and the separation between Power and Communication attachments at that point. Differences in attachment heights and groundline elevations are taken into account for the lower communication attachment as well.
Once Quick Pole understands the closest points between Power and Communication attachments, it then applies a series of tests according to CSA standards. Any violations of mid-span or on-pole separations are highlighted. You should note that Quick Pole doesn't not make any exceptions for effectively grounded neutral wires which may allow closer conditions. It mentions that point on the last page of the report as something the Designer would need to consider separately, if the Designer thought it was applicable.
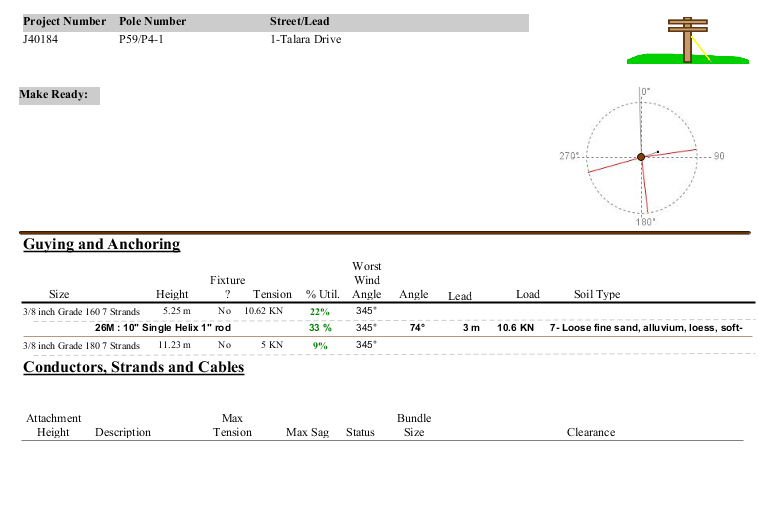
6. Guy and Anchor Strains
This report shows all of the guy tensions attached to each anchor, sorted by angle from the pole and lead length.

At the top of the report you will see "Guy and Anchor Strength Factor". This is derived from the Line Grade for the pole supported by these guys and anchors. In the case of CSA Line Grades, this is the reciprocal of the value for Guy Safety Factor. (e.g CSA Line Grade 2 with Guy Safety Factor of 1.25, Strength Factor = 1/1.25 = 0.80).
The guy tensions come from the "Guy Segment Forces" and are calculated as the resultant of the component forces generated in the Nonlinear Analysis of the pole.
It is important to recognize that the guy tensions are those that are required in order to support the pole at the final step of Quick Pole's Nonlinear Pole Loading Analysis. The attachment loads are multiplied by an overload factor before they are used in this analysis. These overload factors are determined by the Line Grade as well and account for various possible differences between the estimated loads, pole materials and probable scenarios of real loads. More detail on this can be found in the Pole Segment Input Loads section.
For each guy wire, this report shows:
- Description of the guy wire
- Height of attachment
- Fixture ? is set to Yes if the guy wire is attached to a sidewalk fixture.
- Guy Strain (tension) expressed in Kilo Newtons and Kilo Pounds.
- Guy Strength; normally the Ultimate Tensile Strength of the guy wire
- Factored Guy Strength - Guy Strength multiplied by the Guy Strength Factor.
- Informational message related to the guy wire's utilization.
For each anchor, this report shows:
- The total strain on the anchor from all attached guy wires, expressed in Kilo Newtons and Kilo Pounds.
- The Anchor Strength; normally the Ultimate Tensile Strength of the Anchor in the Soil Class set for the anchor.
- The Factored Anchor Strength = Anchor Strength * Anchor Strength Factor
- The percentage strength utilization of the anchor; Total Strain / Factored Anchor Strength.
- The Soil Type set for this anchor.
7. Communication Attachments
This Report is intended to be used to support Attachment Applications by Communication companies to other Pole Line Owners.

While other more detailed reports are available, this report strives to summarize the most commonly asked for information regarding attachment requests. Its purpose is to provide sufficient information for the Pole Line Owner to evaluate the request.
Custom / Expert Reports
1. Pole Attachment Summary
This report is very similar to the Pole Summary report in the General Reports section. It's layout and content may be more suitable to your needs.
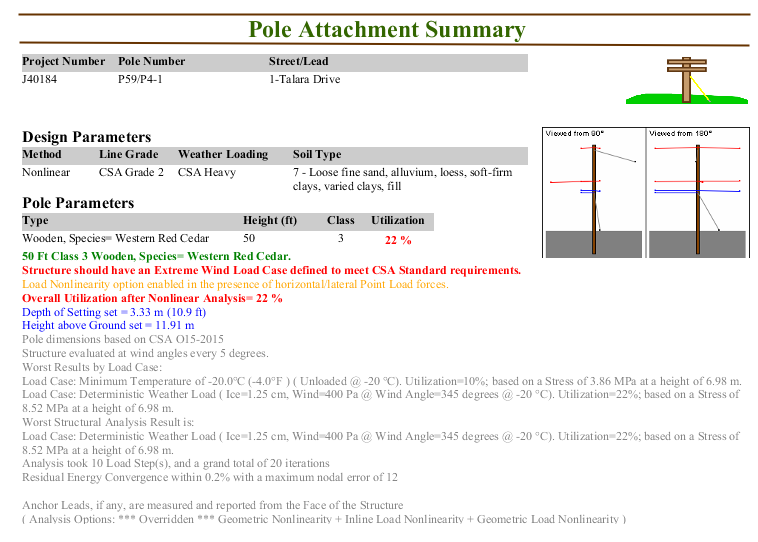
There is a reserved space for a logo on the report, which can be set in user preferences.
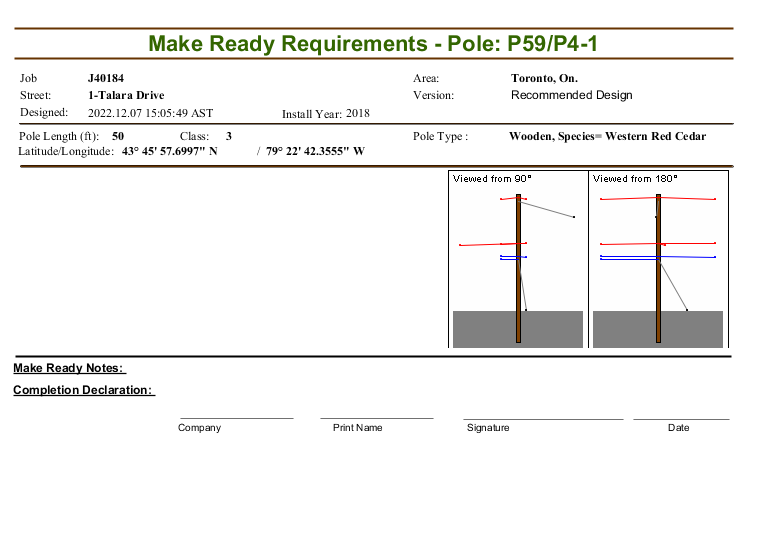
2. Make Ready requirements
This report is designed to list all the site specific Make Ready required and to allow field personnel to sign off on its completion.
3. Detailed Sags & Tensions
This report prints out details of all the sags & tensions calculated for each wire attachment. This includes all design load cases and the conditions of Initial, Final with Creep and Final after Load. You can see in better detail why specific values were chosen in the Sags & tensions Summary and Attachment Loads reports for a specific wire attachment.
This Report is broken up into three major sections and provides significantly more detail on the Sags & Tensions of attachments than the Summary Sag & Tensions Report. Many features within this Report are also similar to the reports available in the Sags & Tensions Tool that is separate from any project. The three Sections of this Report are:
- General (Top) - this section contains some basic physical and rating information about the wire or Self-Supporting Cable. It also includes a determination about which Loading Condition produced the most significant effect when considering
- Maximum Tension
- Maximum Vertical Load
- Minimum Vertical Load
- Maximum Sag
- Maximum Wind
- Bundle Diameter - the diameter of the assumed diameter for ice accretion and wind loading impacts. Where cables are involved, this represents the effective diameter of the bundle of cables attached to the messenger (if applicable). If the User has over-riden the calculated value, the over-ridden value is displayed.
- Summary (Middle) - This section of the Report is identical to the Summary Sags & Tension Report content.
- Details (Bottom) - This section shows most of the detailed results calculated for all the load cases considered under the Initial, Final with Creep and Final under Load situations. The load cases that consider temperature only range from the lowest temperature up to the maximum temperature limit assumed for the wire or self-supporting cable.
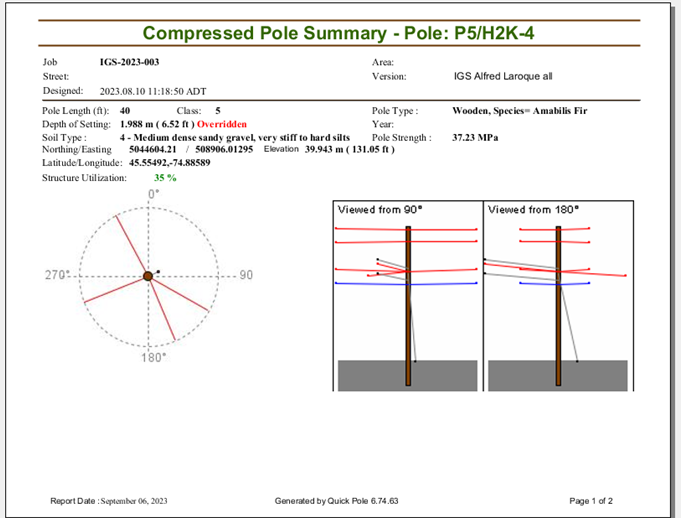
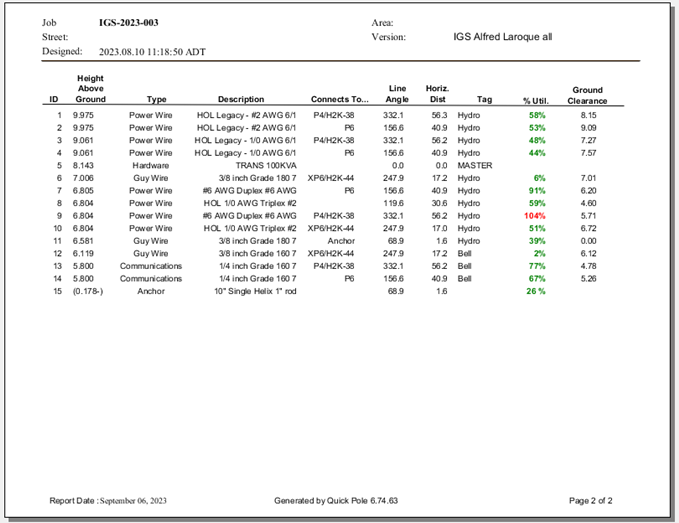
4. Compressed Pole Summary
This report is similar to the Pole Summary Report, but in a much more compressed format. Some details have been removed that are often not required and some information such as minimum clearance to ground values for attachments have been added. In many ways the details presented follow the table in the Structure Editor Window.
Detailed Analysis Results
1. Structure Segment Input Loads
This report shows how all of the attachment loads were applied to the pole’s Finite Element Model prior to the Analysis beginning. The overload/safety factors used are shown at the top of the report so that you can take the attachment loads (from the report) and see that the appropriate overload factor was applied. You can also verify that all loads were applied to the total forces and moments applied at a specific height on the pole.
At the top of the report you can see the Overload Factors that are required based on the Line Grade selected for the pole. These Overload Factors are multipliers that are to be applied to the actual best prediction of Attachment Loads (see Attachment Load reports) before they are applied to the pole. The specific factors to be applied to Vertical, Transverse and Wind related loads are all shown separately. Various other factors are also shown at the top of the report so that you can do your own calculations and compare many of the final values for yourself.
The Assumed Wind Angle indicates the worst angle computed for wind to be applied to the pole and supported spans based on Quick Pole's assessed impact. The Attachment Loads are always recomputed with wind so that they can be applied at any specific angle when applied during the Pole Loading Analysis stage. All angles are global angles that can be referenced from the Work Plan Area orientation.

For each Structure Segment, the amount of Wind Force and Wind Moment is computed that should be applied to the top and bottom of each pole segment. These are shown combined into a single line which includes multiplication by the Wind Overload Factor and using the Assumed Wind Angle. In a similar way the weight of the pole segment and the weight of ice on that pole segment are multiplied by the Vertical Overload Factor and shown in the Pole Segment Line. It should be noted that due to the diameter of each pole segment, ice is assumed to accumulate on only one side of the pole. So the Vertical Load due to Ice would be one-half of the value you would expect if it had the same amount of ice all around the pole segment.
2. Structure Segment Loading
This Report shows the results of the Structural Loading Analysis on the pole structure. For analysis purposes, Quick Pole models the pole into various discrete segments along the pole and between attachment points in order to perform a Finite element Analysis on the pole. Each pole segment's dimensions, flexibility and strength are considered along with that of supporting elements (guys, push braces, other wires) to analyze how the pole would respond to the attachment and storm loads applied. This first set of results are what is called a Linear Structural Analysis, as they do not yet nonlinear effects. Quick Pole then looks at the sideways deflections of the pole and reconsiders the vertical load present at those locations. This deflection coupled with a vertical load imposes an additional bending moment that wasn't originally considered in the Linear Analysis. Quick Pole adds this additional bending moment into the analysis and repeats this process until the effect on the pole is negligible. At this point it is said that a Nonlinear Structural Analysis is complete.
This Report shows the final results of the Structural Analysis at each segment pole modeled along the pole's length, including below the ground (if applicable).
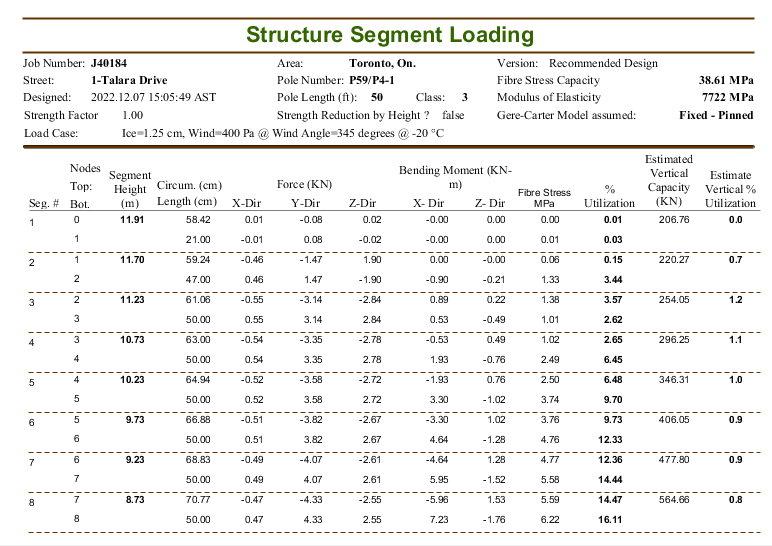
The fibre stress at each point is computed at each segment knowing the forces, moments, dimensions and Modulus of elasticity for the species of wood in the pole. All stress values along the length of the pole are reviewed and the worst value is presented as the summary value for the pole in % Utilization for Stress.
The pole is also assessed for Vertical Buckling purposes. It should be noted that if a pole already has sufficient vertical load to cause buckling, the Nonlinear Analysis would have detected that as it would never have reached a stable condition in its iterations. A calculation is made on Vertical Buckling to provide the designer with an indication of how close the pole is to an unstable situation. A modified Euler buckling formula is used for this purpose based on the work of Gere and Carter. The modification they included is ideally suited for poles that have taper (dimensions larger on the bottom than at the top). As part of this analysis, the Euler or Gere-Carter model is determined by guying conditions on the pole first as it has a large impact on the Vertical Buckling Capacity calculations. The options shown in the top of this report for the Gere-Carter Model assumed can be either "Fixed-Free" or "Fixed-Pinned". In general, all situations will be "Fixed-Free" unless the pole is guyed from at least two significantly different angles.
For Concrete poles, the Fibre Stress column is replaced by the calculated amount of Bending Moment Capacity at that point. The Stress % Utilization column provides a similar function to wooden poles, expressing the ratio of Bending Moments to Capacity as a percentage.
3. Guy Segment Forces
This report details the component forces and moments developed by the guying attachments on the pole (guy wires and Push Braces).

4. Soil Segment Forces
This Report shows the lateral component forces exerted by the soil surrounding the structure beneath the groundline. It completes the Structural Analysis in clarifying the amount of support expected to be delivered by the Soil. The vertical load component on the bottom pole segment against the soil is extracted from the Structure Segment Loadings Report and is not shown here. A comparison of the Soil Strength for Vertical Loading purposes is evaluated and reported on the Pole Summary Report.
The soil is modeled at each pole segment as consisting of two equivalent guys (one for each direction X & Z), creating two separate rows for each pole segment. The Y position indicates the distance below the groundline for each pole segment.
5. Attachment Load Changes
This Report is specifically designed to support the Attachment Load Nonlinearity feature. It shows the changes in forces that result when this feature is considered. For Pole Loading purposes, both the original estimated forces from the attachments, plus these changes, are applied to the pole.

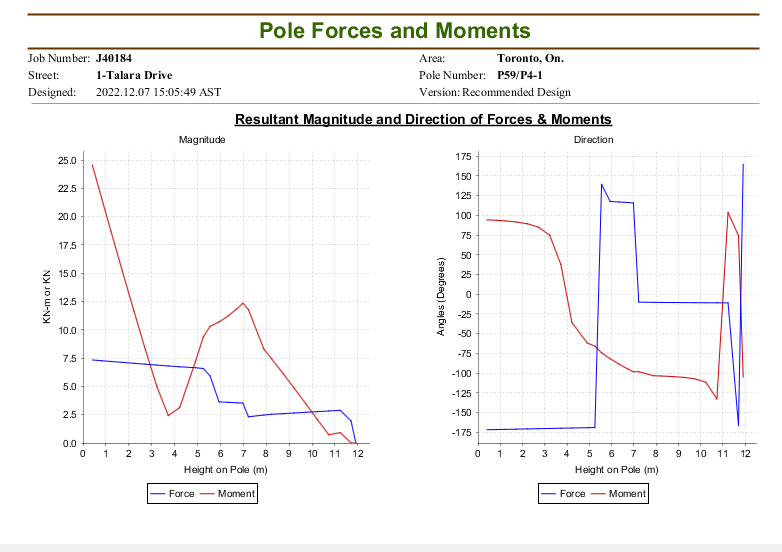
6. Pole Forces and Moments
This Report contains two pages of graphs. The first page shows the Resultant Magnitude of the Forces and Moments on a Pole after the Loading Analysis. Both pages are a graphical view of the results from the Pole Segment Loading Results.
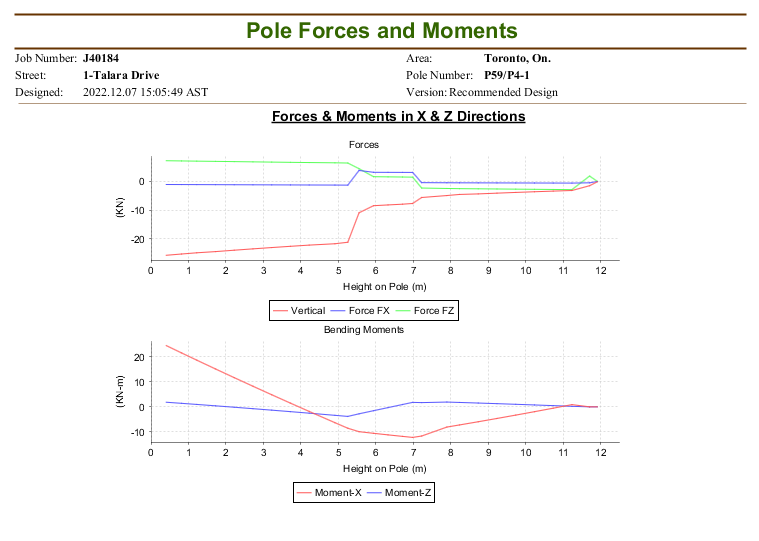
The second page shows the individual directional components of the Forces and Moments.
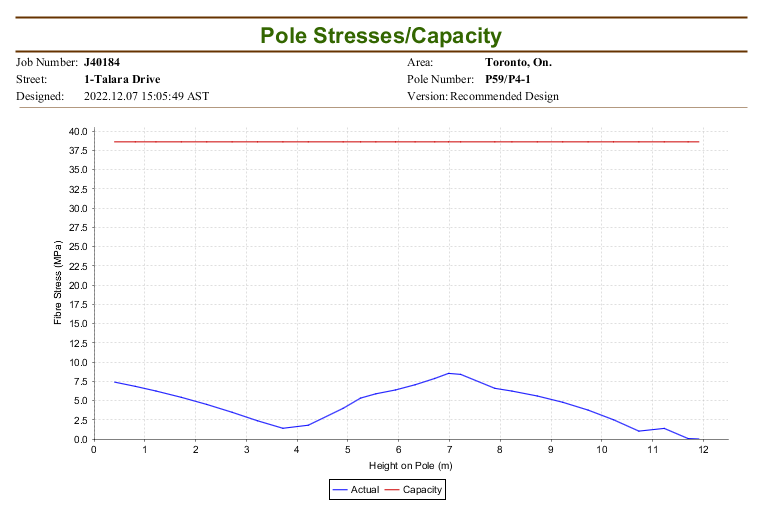
7. Pole Stresses/Capacity
This Report shows a graphical view of the Strength Capacity in the pole under the worst conditions considered in the Structural Analysis. The plotted values are from the Pole Segment Loading Results Report. The report below is shown for a Concrete Pole, showing both capacity and actual values. for a wooden pole, the Fibre Stress Capacity is constant at all points on the pole.
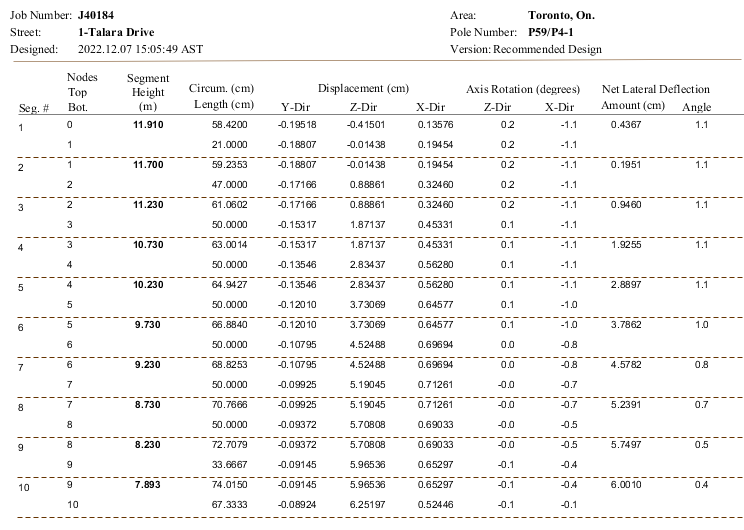
8. Pole Deflections
This Report shows both a graphical view and tabular report of the pole's physical movement under the worst conditions considered in the Structural Analysis. It provides a physical distance deflection from being perfectly vertical, and the angle the pole is leaning towards.
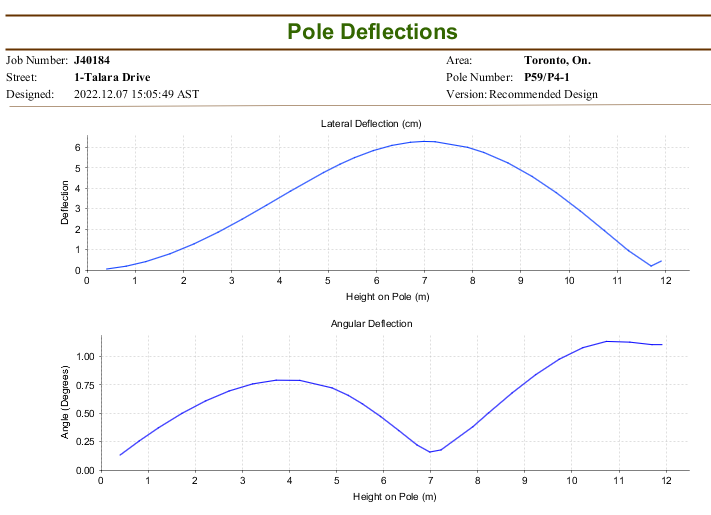
The subsequent pages provide a tabular report showing the deflection values in more precise format.
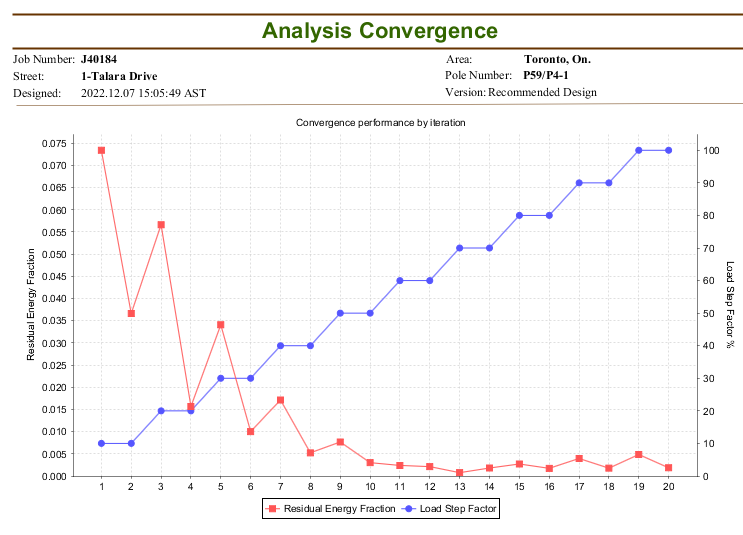
9. Analysis Convergence
This Report shows some insight into how easily and quickly Quick Pole's Non-linear Algorithms converged on a stable and final solution. Below are examples of a stable pole and one that was determined to be unstable. Most users may not be interested in these reports.
Quick Pole uses pole deflections in its algorithms to determine if the answer is becoming stable on a final value. Some poles will be solved quicker than others, depending on their differences. Quick Pole adds the absolute value of all pole deflections in the X and Z direction across all modeled pole segments to come up with an aggregate Displacement Metric. These reports will show how this metric changes for each iteration of the Non-linear algorithm.
10. Post Analysis Nodal Summary
This report shows how well Quick Pole solved the fundamental engineering equation for static forces - "the vector sum of all forces acting on the structure must be zero".
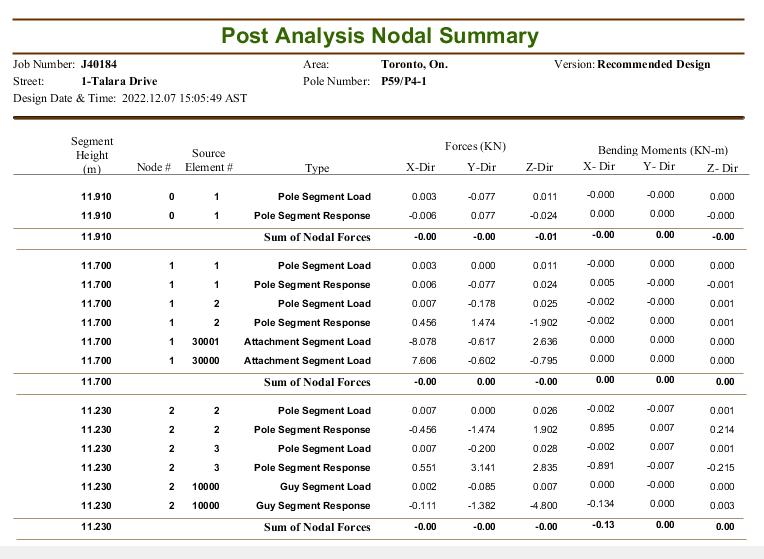
Quick Pole will stop the Nonlinear iterations of computations when the desired result at each node and for the whole structure are reasonably close to zero; based on the sizes of the forces involved. This allows Quick Pole to provide very accurate results within a short amount of time.