Sags & Tensions of Span Attachments
Final Load Curve
 The Final Load Curve is a large contributor to the Sag and Tension results. It represents how the material behaves after it has seen the worst tension and loading condition expected. More on this later.
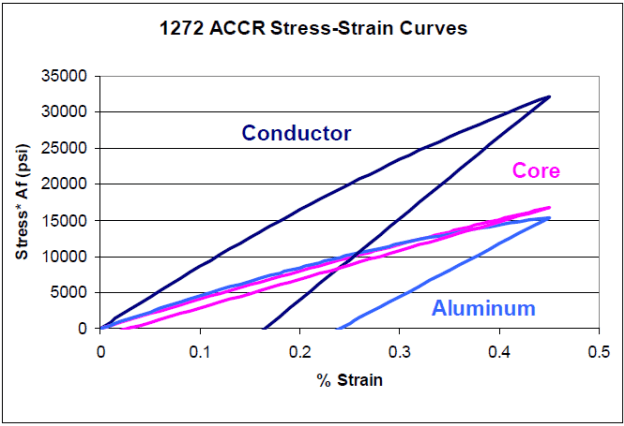
Let's look at an example of a 3M 1272 ACCR Conductor: The violet curve shown represents the steel core of the wire. Its upper curve shows the Initial Curve as stress is gradually applied to the core. The lower violet line shows the core's behavior as the stress is removed. It follows the Final Load Curve for the Core. The light blue curve represents the Aluminum outer wires of the conductor and follows the same logic; except it is easier to see the difference between the Initial and Final Load Curves. The dark blue curves show how the core and outer wires, in their proper proportions, may come together to respond as a unit.


