View Results
When you first select this tab it will show you a view of the Span Profile, including all defined span attachments and any clearance or mid-span points that have been defined.
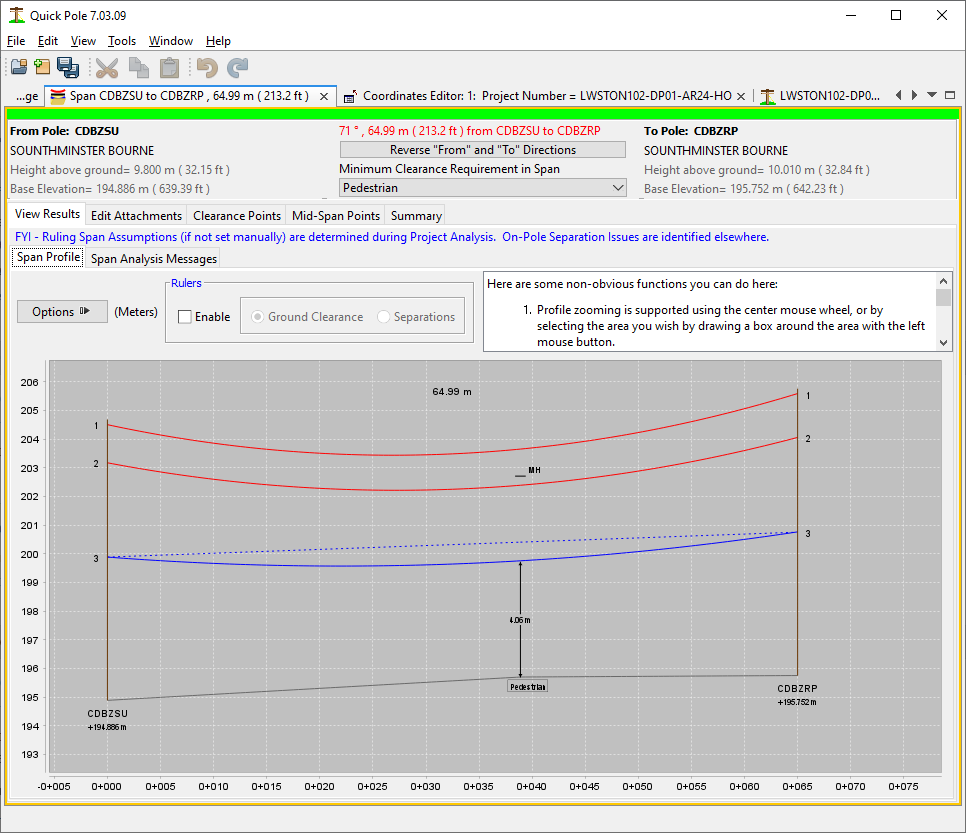
The attachments are usually shown in their Maximum Sag condition, which can be different for each attachment. The annotation numbers shown correspond to the row numbers in the tables on the Edit Attachments tab.
Options exist to customize this profile to include information in many different ways. You can see these by pressing the "Options" button.
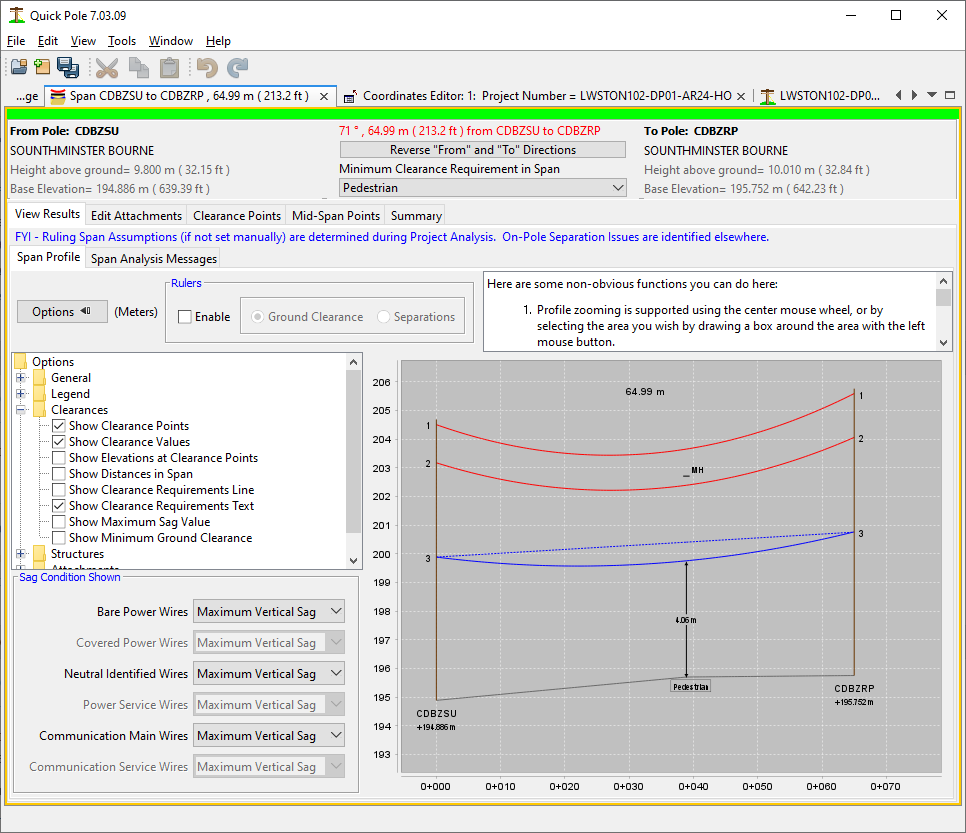
Feel free to experiment with these so you know what they do. Quick Pole will remember your last options here. Similar options exist for printing the Span Profile reports, which are separate from these, and can be set under Quick Pole settings.
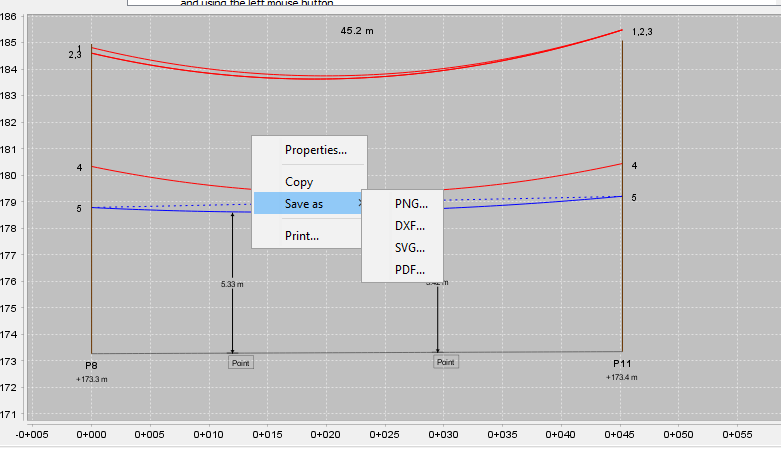
As can be seen in the image above, certain options are available through a right-click on the image. The most popular ones are expected to be:
- Properties - shows some chart properties you can change.
- Copy - This provides a copy of the image onto your computer's clipboard. This allows you to paste the image directly into another application (Word, Excel, Power Point, Visio, AutoCad, etc)
- Save as. This helps with including images/files into other software applications. There are four options: PNG, DXF, SVG and PDF.
- Print the Image. This can be to any printer, including any defined to generate pdf files.
Also associated with the span profile are the analysis messages associated with these span attachments. After every change in the Span Editor/Viewer window, these span attachments are recalculated immediately.
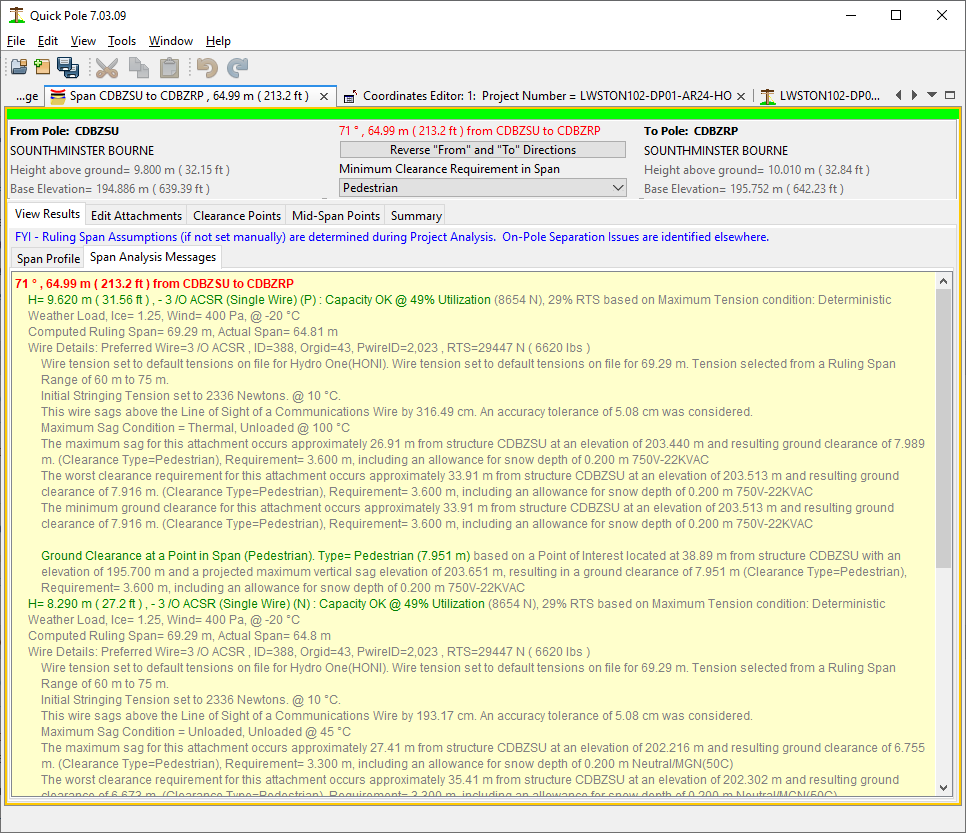
For more information on analysis messages in general, please visit here.